| Activity metrics | Units | 2021 | 2022 | 2023 | 2024 | 2025 |
|---|---|---|---|---|---|---|
| Production1 | ||||||
| Production | MMboe | 5.97 | 7.40 | 6.59 | 6.35 | 5.74 |
| Production | Kboepd | 16.4 | 20.2 | 18.1 | 17.4 | 15.7 |
| Pillar 1: Promoting socio-economic prosperity2 | ||||||
| Total Contributions | US$m | 55.1 | 56.9 | 52.0 | 63.4 | 92.3 |
| Payments to local suppliers and contractors | US$m | 26.2 | 22.9 | 23.5 | 30.6 | 31.3 |
| Pillar 2: Ensuring safe and secure operations3 | ||||||
| LTIR | Injuries per 200,000 working hours | 0.00 | 0.34 | 0.00 | 0.00 | 0.00 |
| TRIR | Incidents per 200,000 working hours | 0.34 | 0.68 | 0.00 | 0.00 | 0.00 |
| Number of fatalities | Numerical value | 0 | 0 | 0 | 0 | 0 |
| Number of security incidents | Numerical value | 1 | 11 | 10 | 4 | 5 |
| Number of transport incidents | Numerical value | 2 | 1 | 2 | 0 | 0 |
| Total length of journeys safely managed | km | 1,358,416 | 1,384,336 | 1,424,803 | 1,455,523 | 0 |
| RTAR | Accidents per 200,000 km | 0.29 | 0.14 | 0.28 | 0.00 | 0.00 |
| Health, safety and environmental training | Hours | 1,667 | 861 | 4,988 | 13,891 | 6,085 |
| Pillar 3: Supporting and developing our people2 | ||||||
| Number of employees | Numerical value | 230 | 277 | 276 | 271 | 278 |
| Training | Hours | 6,104 | 12,754 | 15,858 | 20,306 | 19,408 |
| Gender diversity in senior management | % | 35% | 32% | 33% | 32% | 31% |
| Group gender diversity | % | 19% | 22% | 22% | 22% | 19% |
| Percentage of local employees in Nigeria | % | 99% | 99% | 99% | 99% | 99% |
| Percentage of local employees in Niger | % | 100% | 100% | 100% | 100% | 100% |
| Ethnic minority representation in the UK | % | 24% | 38% | 40% | 45% | 37% |
| Pillar 4: Respecting the environment1 | ||||||
| Scope 1 GHG emissions | tonnes CO2e | 66,877 | 71,543 | 70,741 | 36,101 | 52,094 |
| Scope 2 GHG emissions4 | tonnes CO2e | 88 | 61 | 63 | 116 | 179 |
| Energy use in UK | kWh | 164,638 | 112,586 | 139,650 | 367,819 | 613,010 |
| Carbon intensity (Scope 1) | kg CO2e/boe | 11.2 | 9.7 | 10.7 | 5.7 | 9.1 |
| Carbon intensity (Scope 1) | tonnes CO2e/'000 tonnes hydrocarbons | 82.1 | 71.1 | 78.7 | 41.7 | 66.5 |
| Carbon intensity (Scope 1, 2 and 3) | g CO2e/MJ | 52.8 | 52.6 | 54.9 | 51.3 | 43.4 |
| Operational hydrocarbon spills | Numerical value | 0 | 0 | 0 | 0 | 0 |
| Fresh water use4 | m3 | 6,848 | 8,376 | 10,592 | 12,430 | 15,429 |
Note that the equity share of Stubb Creek production has changed from 20.0% in 2021, to 25.4% in 2022, to 32.8% in 2023, and 30.8% in 2024 (based on share of production).
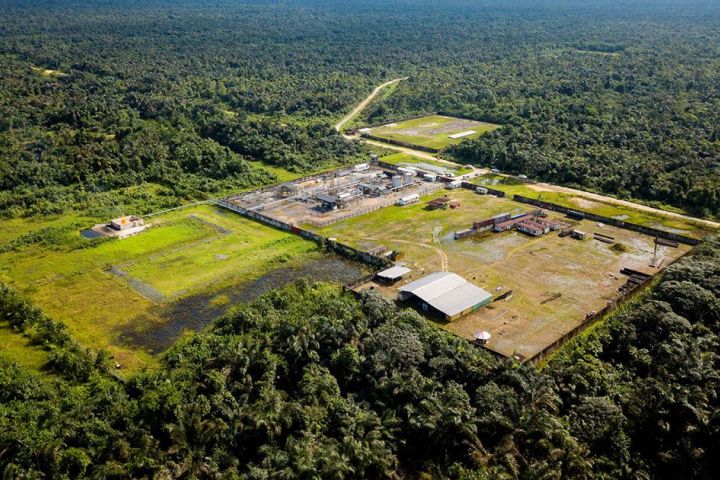
The increase in equity share at Stubb Creek between 2021 and 2024 has resulted in an increase in reported emissions of approximately 12% over this period. Our equity share of Stubb Creek increased to 100% after March 2025 as a result of the SIPEC Acquisition, this resulted in an increase of reported emissions of approximately 40% in 2025.
The equity share of our Accugas and Uquo assets was unchanged at 80% throughout this period.
1. Reported by equity share %.
2. Reported at 100%.
3. Reported by operational control (currently 100% for all assets).
4. 2021 and 2022 water use restates. Scope 2 GHG emissions restated for 2022.